Bitcoin Price Prediction – January 22
The Bitcoin price prediction extends the bearish movement to the areas marginally below $35,000 after numerous trials to sustain gains above $36,000.
BTC/USD Long-term Trend: Bearish (Daily Chart)
Key levels:
Resistance Levels: $40,000, $42,000, $44,000
Support Levels: $30,000, $28,000, $26,000
BTC/USD falls toward $34,000 once again as the largest cryptocurrency embarks on a support smashing exercise after failing to hold above $36,000 resistance level. Therefore, the bearish control is seen across the market with other major digital assets posting similar losses as they move towards the lower boundary of the channel.
Bitcoin Price Prediction: BTC May Touch $25k Support
The Bitcoin price is trading at $34,534.91 with an intraday loss of 5.27%. The prevailing trend is bearish with expanding volatility. The first digital asset is currently consolidating in a bearish flag pattern. Meanwhile, a break down from this pattern is supposed to continue in the direction of the previous trend. In this case, BTC/USD is expected to drop and stay below the channel and could move towards the critical support levels at $30,000, $28,000, and $26,000.
However, should Bitcoin price head to the north and move towards the moving averages; the price could rise to $36,000 vital resistance. A further bullish drive could push the price to $40,000, $42,000, and $44,000 resistance levels. The technical indicator Relative Strength Index (14) is revealing more signs of trend retreatment, which shows a possible more bearish momentum may continue to play out.

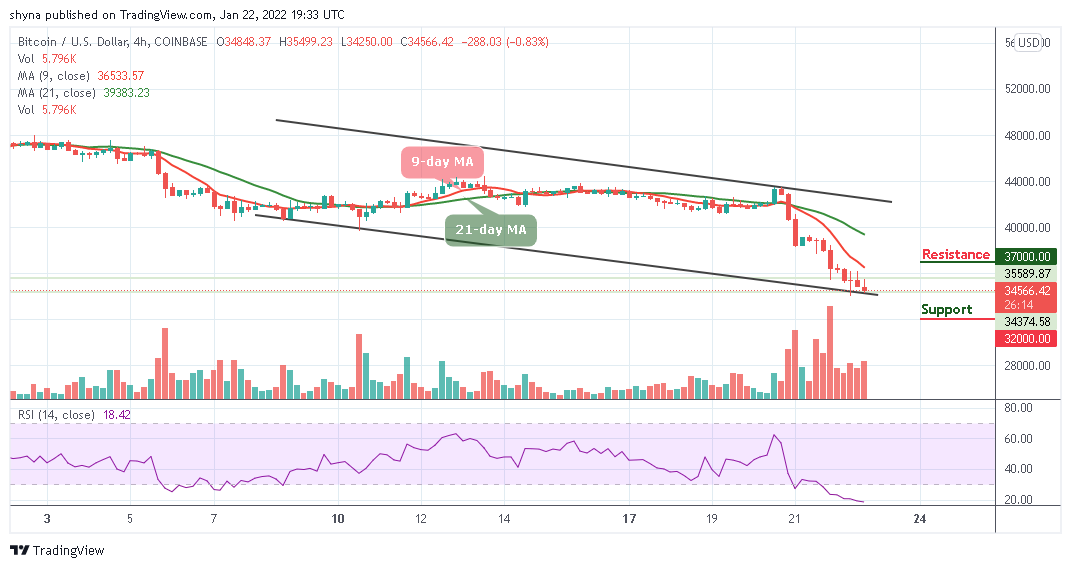
BTC/USD Medium – Term Trend: Bearish (4H Chart)
At the opening of the market today, the Bitcoin price remains within the negative side as the coin continues to move below the 9-day and 21-day moving averages, bringing its price from $35,499 to reach around $34,250. Should the price continue to drop further and move below the lower boundary of the channel, it could reach the nearest support level at $32,000 and below.

Moreover, if the bulls push the coin above the 9-day moving average, the Bitcoin price is likely to touch the potential resistance level of $37,000 and above. Presently, the market may remain at the downtrend as the technical indicator Relative Strength Index (14) moves within the oversold region.
Looking to buy or trade Bitcoin (BTC) now? Invest at eToro!
68% of retail investor accounts lose money when trading CFDs with this provider
Read more: